
Society is becoming increasingly aware of the interconnectedness of all things living on this planet. The critical role which bees play in plant pollination is currently receiving much attention so we decided it would be interesting to learn a little more about these fascinating creatures. What better way to do this – at least for people who would like to avoid being stung – than to use some of the sensor technologies being developed as part of the Internet of Things (IOT) to monitor and stream data from an actual busy hive? Of course we will need a hive and a cooperating colony of bees. The hive we can buy along with the monitoring technology (more to follow). We are reasonably confident we can marry the technology and the hive but we will take advice from experienced bee keepers as to how, where and when to combine the hive, bees and technology. Ultimately, we would like to be able to remotely monitor the hive habitat, hive activity and learn something of the daily activities of the bees through analysis of data flowing from the hive sensors. We are currently involved in stage 1 – ordering the hive and the technology. Stage 2 will be concerned with ‘instrumenting’ the hive and testing wireless/cloud connectivity and data logging. Moving the hive to an apiary and getting a beekeeper to install the bees will comprise Stage 3 of the project and finally Stage 4, the really interesting bit, is where we get everyone involved in collecting data, analysis of the data and perhaps suggesting interesting experiments to carry out.
As of June 2019, stages 1-3 of the plan have been implemented. For details, see the ‘Beewise’ blog which gives a week by week account of the hive.
(Image credit: Vincent Casey)
https://eu1.zachranvcely.sk/76360a7a716b48da9b237cb3673cfd5b
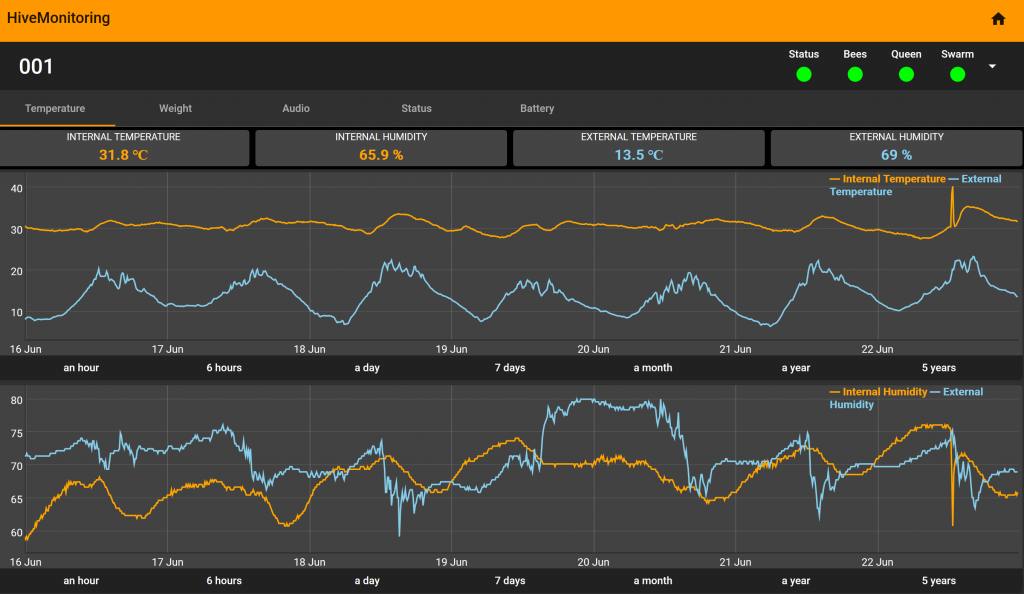
There are two categories of data streamed to the app: ‘Internal’ data comes from the sensor heart placed over the brood within the hive; ‘External’ data is from the multi-sensor monitor which is outside and underneath the hive. You can change the data viewed by clicking on the tabs at the top of the display. You can change the time interval used to display the data from hours to days to weeks and longer. The ‘green lights’ at the top indicate that all is well with the brood.